SigViz
Tutorials & visualizers for signal processing.
Home
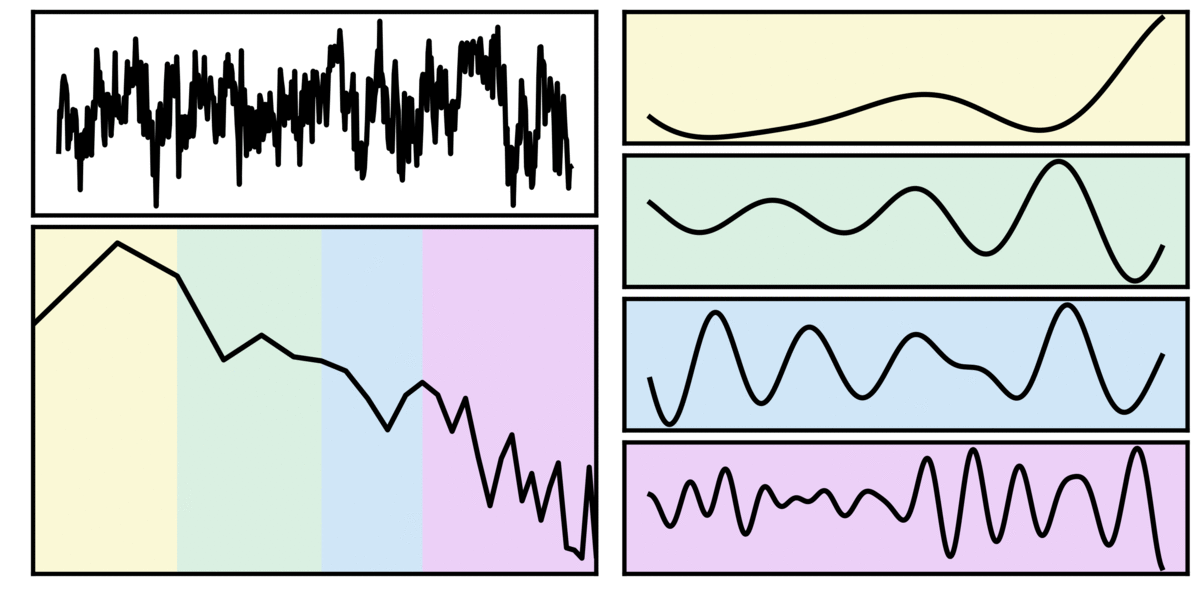
Signals
Time Domain
Transforms
Fourier
Convolution
Filters
Tutorial
1) Overview
2) Processing
3) Electrophysiology
4) Spectral Parameterization
Neuro-Electrophysiological Signals
So far we have discussed some basic principles of time-series analyses and digital signal processing. In this section we continue with the same principles, now linking these ideas directly to the study of neuro-electrophysiological recordings such as M/EEG.
In doing so, we will consider an analysis framework in which we are interested in examining oscillatory activity in EEG as it relates to cognition. This could be, for example, a study in which we recorded EEG data will subjects did a cognitive task, and we would like to know if oscillatory activity predicts behavioral performance.
From the discussions so far, we know that we can apply transforms to the data, such as Fourier transforms and filters, to examine frequency domain representations and extracted components of the data. However, we also have to keep in mind that these methods by themselves do not guarantee we are measuring or extracting true rhythmic activity, especially since neuro-electrophysiological recordings such as EEG feature prominent aperiodic (pink noise like) activity.
For these examples, we will also use a standard definition of neural oscillations, where there are multiple band ranges of interest, defined here as delta (1-4 Hz), theta (4-8 Hz), alpha (8-12 Hz), and beta (13-30 Hz).
Oscillation Presence
First, let’s consider how to our transforms of interest (Fourier transforms and filters) relate to potential analyses of EEG data.
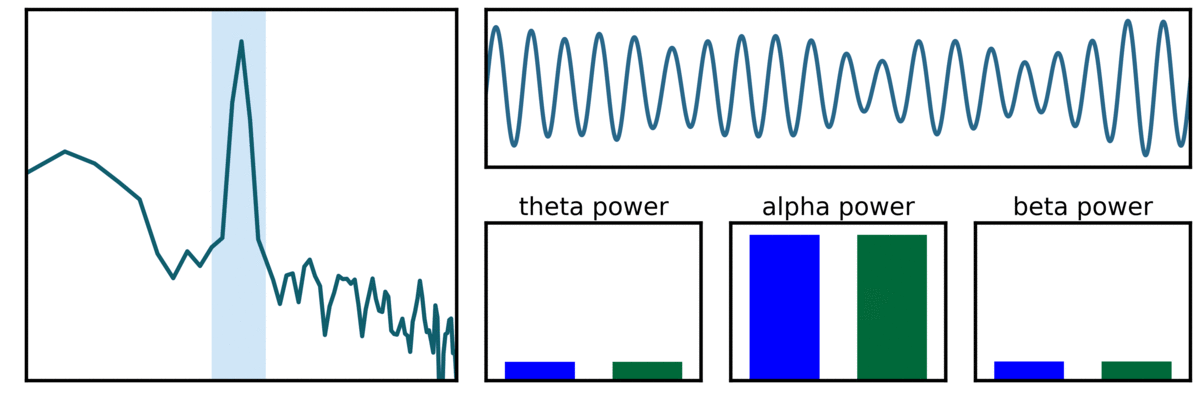
In the following, we have a time series of data (top left) of what could be a channel of EEG data, which is also reflected in the power spectrum (bottom left) and with a bank of filters (right) that are tuned to our set of oscillatory ranges.
As we have already seen in previous examples, both the power spectrum and filter outputs suggest non-zero power at frequencies of interest! However, this activity is not necessarily oscillatory. Indeed, in this example, the simulated time series the data is pure pink noise.
So how do we identify if there actually an oscillation? One piece of evidence we can look for is if there is a peak in the power spectrum, as this is evidence of frequency specific power that is suggestive of an oscillation.
Oscillation Location
Next let’s consider measuring potential peak activity, again considering the set of canonical band ranges we listed above.
In the following visualizer, we are interested in alpha activity (shaded blue range), with two example signals, a 10 Hz centered signal (blue) and another signal that is changing in its center frequency (green):
As we can see in the above, in comparing the two signals using a pre-defined alpha band range of 8-12 Hz, the answers we get about the power differences between the signals across the different bands is actually driven by the changes in center frequency of the rhythm in the green trace.
This points out that in examining putative oscillatory activity as peaks of power, we also need to pay attention to where, in frequency space, these peaks occur! Notably, using canonical band ranges without evaluating potential differences in center frequency can lead to mis-interpretations.
Aperiodic Neural Activity
Finally, lets consider an example case in which the aperiodic activity of the recorded signal is changing / different between signals of interest:
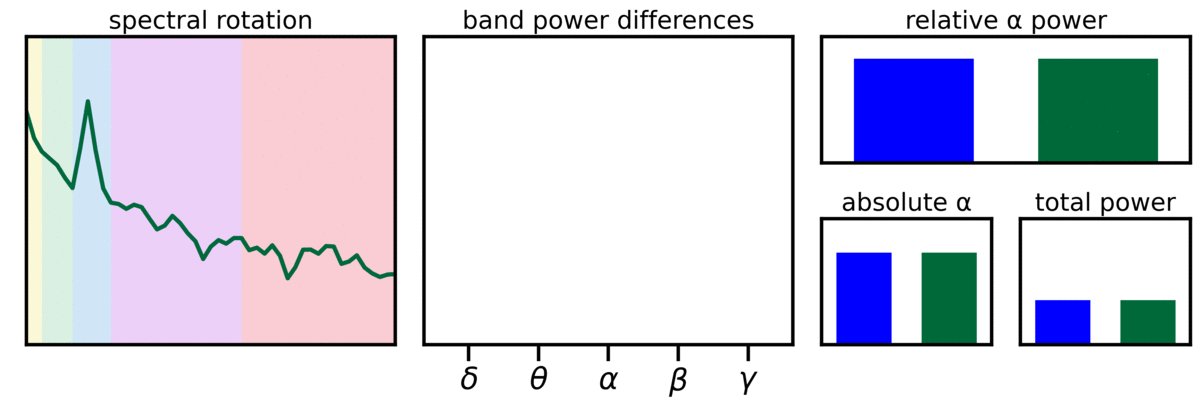
Note that in this visualizer, it is only the aperiodic component of the data that is changing. Despite this, we can see that in looking at measures of different frequency ranges there are differences in specific band ranges can be driven by changes in the aperiodic component of the data. This is also true of the relative power measure of alpha, which also varies with the aperiodic component.
Note that in the above example, the rotation point of the aperiodic activity is at the location of the alpha peak, so we do not see any differences in absolute alpha peak height. This could also be different if the aperiodic activity changed at a different frequency point - for example, if the aperiodic activity rotated at 20 Hz, we would also an aperiodic driven change in the absolute alpha measure, even if there is actually a peak there which is not itself changing.
This emphasizes that in examining power differences, we need to consider and address potential differences or changes in aperiodic activity, suggesting that peak power measures should be relative to the aperiodic component of the data.
Interim Conclusions
In the above, we explored how the topics & problems we identified in signal processing relate to the analysis of M/EEG. Notably, we explored 3 possible issues with trying to measure oscillatory activity - lack of oscillation presence, variable oscillation frequency, and variable aperiodic activity. As well as highlighting potential issues, these topics also suggest some strategies for how we can design analysis strategies for measuring oscillatory activity:
- identify that the there is evidence of frequency specific activity (i.e. a peak in the power spectrum)
- identify where in the power spectrum this peak is (i.e. data-driven frequency ranges of interest)
- evaluate if changes in frequency ranges of interest are oscillation-specific, and/or if could be explained by changes in aperiodic activity
Sources
This section draws on the Oscillation Methods project, where you can find more information on related topics as well as implementations to create the examples.